
Emerging Market equities have been hovering around a 20-year valuation low versus their Developed Market counterparts for the last 5 years. We believe this is about to change, with the stars aligning for a sustained period of EM outperformance. In the paper below we outline why, before discussing why we expect our EM portfolios to see even stronger performance, with our differentiated process of integrating top-down analysis and bottom-up research yielding some of the most attractive alpha opportunities that we have seen in years.
MSCI EM/S&P 500 cyclically-adjusted P/E (CAPE)
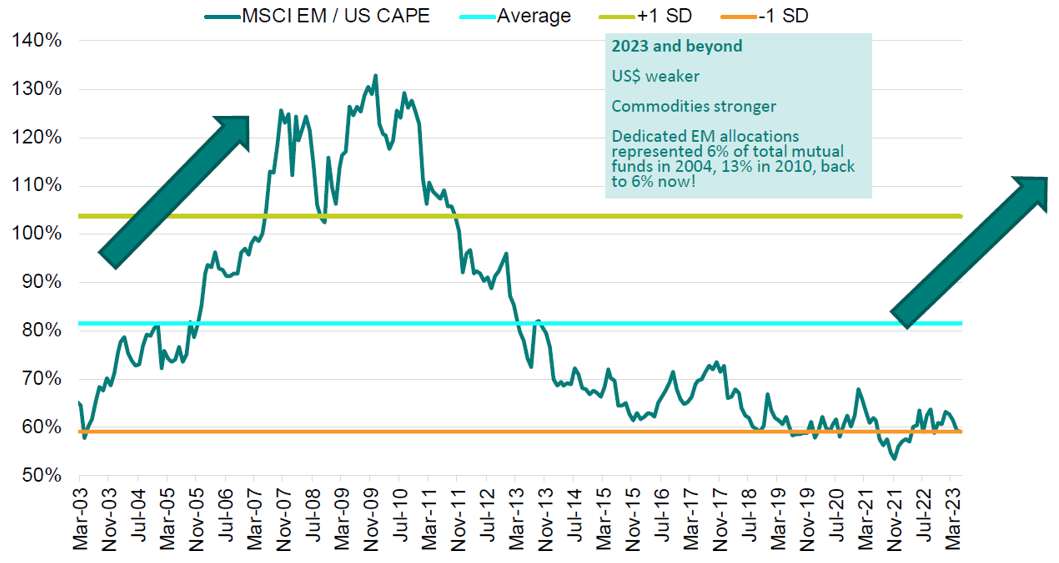
Source: Bloomberg | TT International | J.P. Morgan
If we consider the conditions where Emerging Markets have outperformed historically, there are several reliable indicators. EM assets are often bought for their superior growth prospects. It therefore follows that periods of rising relative GDP growth tend to correlate well with EM equity outperformance. The chart below shows that from 2018-2022 the real GDP growth differential was reasonably low and indeed fell over the period, acting as a headwind for EM performance. However, it is expected to expand substantially in 2023 and 2024, with DM growth slowing at the same time as EM growth accelerates. This should act as a tailwind for EM equities.
Real GDP Growth (%)
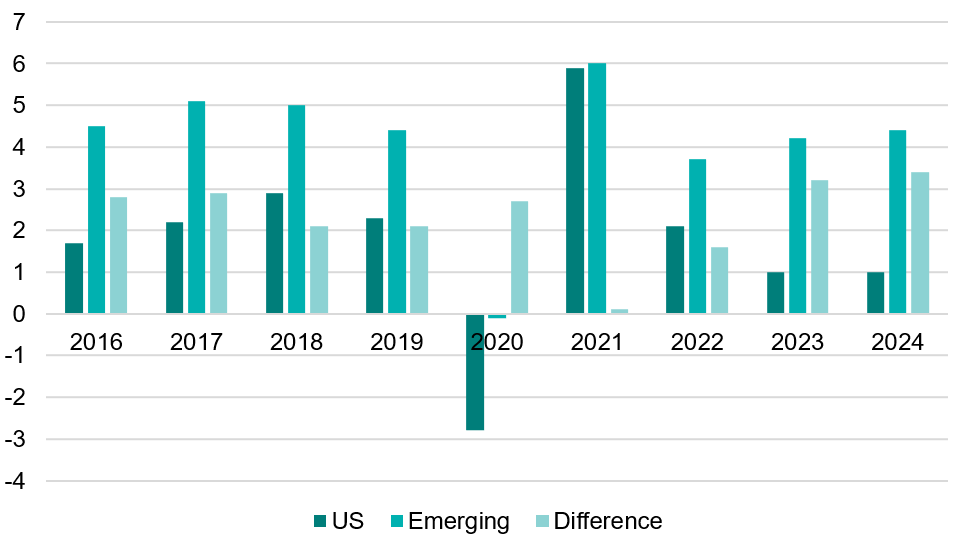
Source: Bloomberg | TT International
The other two factors that exhibit extremely strong correlation with EM equity performance over time are commodity prices and the dollar. We are often asked why EM equity performance has been disappointing relative to DM over the past decade. By contrasting the period between 2003 and 2008, when EM substantially outperformed, with the period between 2010 and 2022, it becomes obvious that the direction of the dollar and commodity prices provides the answer.
EM equities versus commodity prices and the dollar
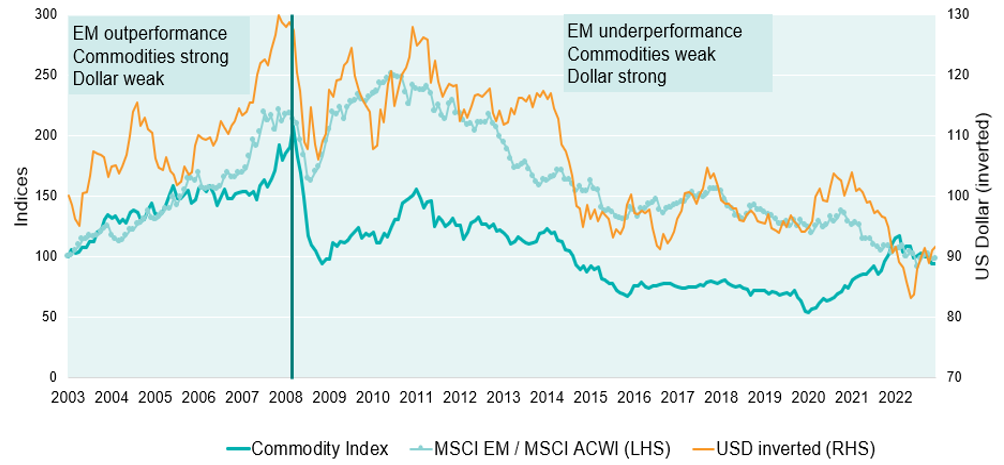
Source: TT International | Bloomberg
With this in mind, perhaps the key question that we need to ask is: how will the dollar and commodities perform going forward? In our view the outlook for much of the commodity complex remains positive. On the demand side, a reopening of the Chinese economy is supportive, as is ongoing strong economic performance in India. A rapid acceleration in the transition to electric vehicles and clean energy is also driving a massive boost in demand, which looks unlikely to be met with existing production. Despite historically low borrowing costs, supply additions in most commodities have been very conservative in recent years, partly due to geopolitical tensions and a general reluctance to invest in countries perceived to be corrupt and insecure. Long lead times for greenfield expansion suggest to us that in some commodities such as copper, a renewed super cycle is a distinct possibility.
The dollar has reigned supreme for so many years that on most metrics of purchasing power parity it is substantially overvalued. The US economy has so far held up reasonably well, but of course monetary policy acts with a lag, and we continue to expect a mild US recession in the second half of the year. A slowing rate of US economic growth will likely exert downward pressure on the currency and, as other major central banks catch up with the Fed, so their interest rate differentials will narrow versus the dollar, adding further pressure. Although we do not expect a collapse in the currency, the trend over the next few years will be lower in our view. Given these anticipated trends in relative economic growth and dollar weakness, as well as investor positioning and valuation levels, we believe that EM equities will enjoy a period of sustained outperformance.
While the asset class in general appears to represent a compelling investment opportunity at this juncture, we believe our EM portfolios are well placed to see even stronger performance. Indeed, our differentiated process of integrating top-down analysis and bottom-up research is yielding some of the most attractive alpha opportunities that we have seen in years, as expressed by our strong active country bets and single stock positions. We are extremely positive on our current portfolios, more so than we have been for a long time, and believe that many holdings are only just starting to see the benefits of near-term macro catalysts. This piece will now take a deep dive into our biggest overweight, Mexico, to demonstrate the crucial linkage between top-down and bottom-up analysis, before briefly exploring our other exciting exposures.
We believe Mexico will be the biggest winner from the ongoing divorce between the US and China, given its location, trade-agreements, economic stability and low-cost labour pool. US imports are around $4 trillion per year, of which Mexico accounts for 10-12.5% (some $450bn). In our view, based on FDI investments that have already been announced, this share can grow by a further 3-4% to around 15%. This would represent an additional $150bn of exports for Mexico, which equates to 10% of GDP. Mexican GDP growth over the last 20 years has averaged about 2.2%. We believe that this rate can pick up to 3.5-4%, largely driven by increasing exports to the US. As can be seen from the graph below, prior to NAFTA, around 6% of US imports came from Mexico. That figure doubled and then stagnated ever since China became a member of the World Trade Organisation in late 2001. Meanwhile, following its accession to the WTO, China’s share of US imports increased from 8% to a peak of 22%, before falling by 3-4% due to the ongoing trade war and geopolitical tensions.
Shares of US total imports
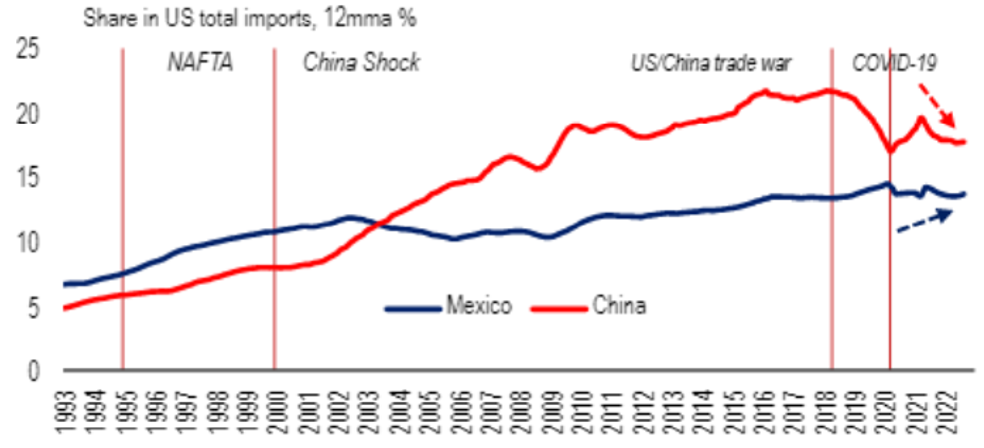
Source: BofA Global Research | Haver | US Census Bureau
Looking at the far right-hand side of the chart below, we can see that the biggest beneficiary of this market share loss has been Mexico.
US imports from world versus Mexico
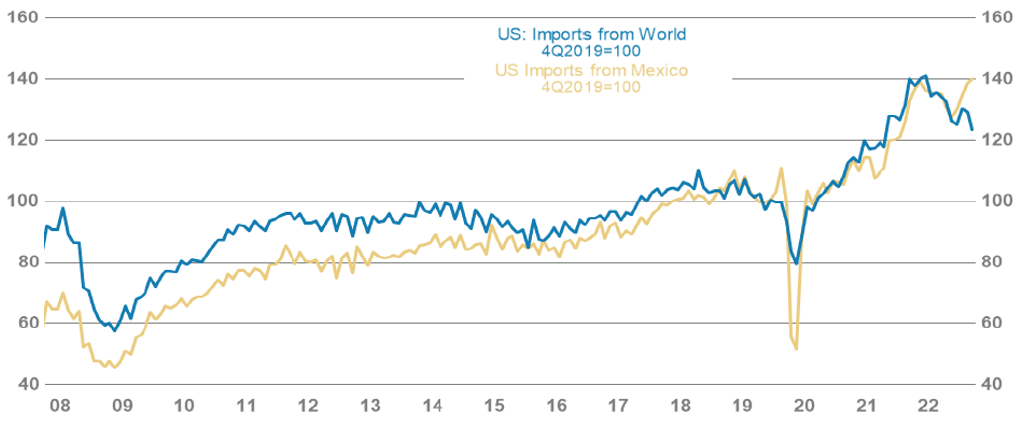
Source: Census Bureau | Haver Analytics
These trends have no doubt been exacerbated by the growing differential between unit labour costs in Mexico and China, with Mexican labour now roughly one-third of the cost of that in China.
Mexican labour is considerably cheaper than Chinese labour
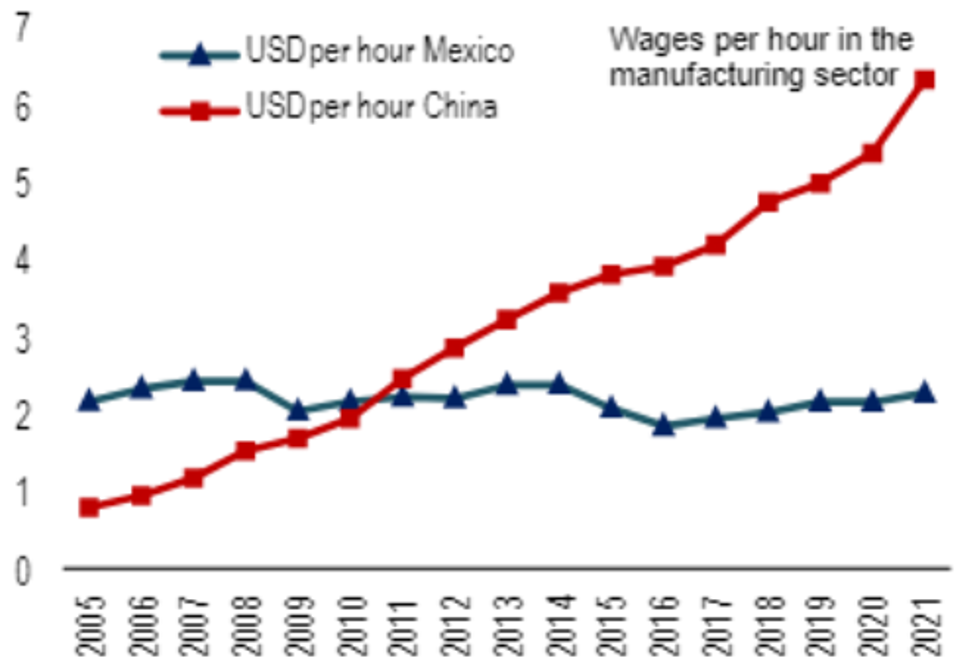
Source: ILO | INEGI
Clearly then, Mexico has an exciting top-down opportunity due to nearshoring. However, to build our conviction in the market, we must delve deeper to paint a more detailed picture of the wider macroeconomic backdrop. The proprietary analysis shown below is typical of the top-down work we conduct on a country-by-country basis, and is similar to the analysis I performed during my time as an Analyst at the Central Bank of Argentina.
Mexico top-down analysis
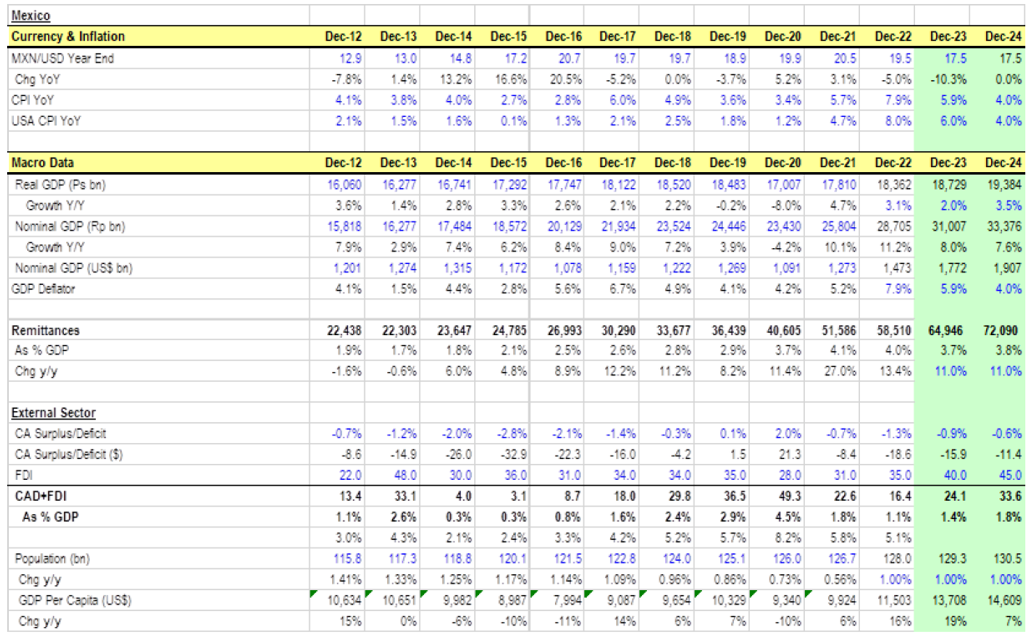
Source: TT International | Bloomberg
As can be seen, remittances as a % of GDP have increased from 2%-4%. FDI was running in the $30-35bn range, but is now up at $40-45bn, and will likely rise further. FDI has many positive externalities for a labour market, particularly for a country like Mexico, where 50-60% of labour is informal. That proportion will fall as formal employers enter the market, while supply chains and SMEs will also benefit greatly. Moreover, Mexico’s debt-to-GDP ratio is very manageable at less than 50%, the country runs a primary surplus, and its current account is in balance. Mexico’s macroeconomic backdrop would therefore appear to be very stable. There is also a positive picture with regard to real rates.
Mexico real rates
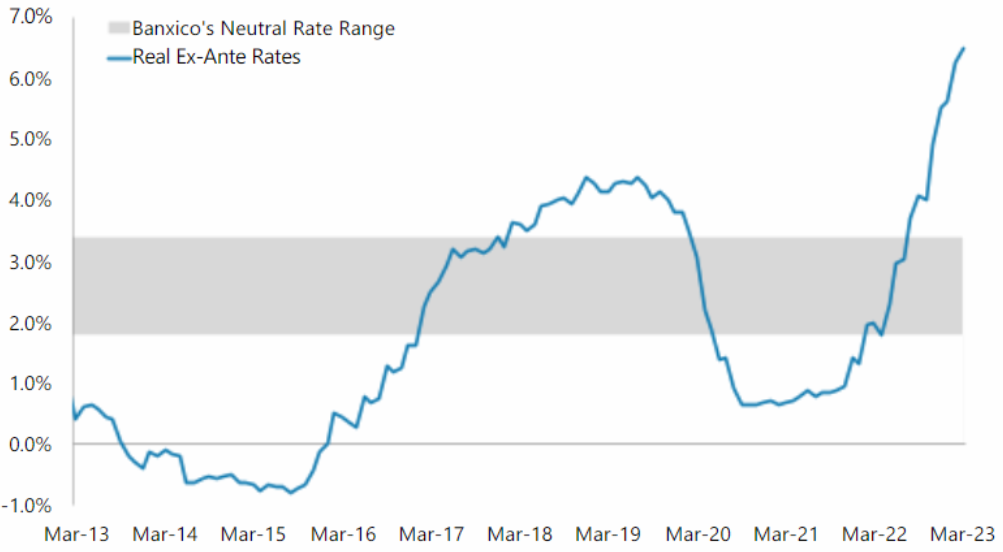
Source: Banxico, Morgan Stanley Latam Economics
At over 6%, real rates in Mexico are close to the highest available in EM, providing significant flexibility for monetary stimulus, should trends deteriorate. Our view is that US rates are now around their peak, providing room for Mexican real rates to fall back into the 2-3.5% corridor that appears to be their ‘neutral’ level. As rates come down, we should see a pickup in domestic demand, particularly as formal employment will be rising.
The final top-down catalyst that very few analysts seem to have fully appreciated is that there has been major pension reform in Mexico, which should be supportive for equity markets by providing a consistent marginal buyer. Currently employers must contribute 6.3% of salary into one of the Mexican pension funds known as AFOREs. This number will double over the next 5 years to around 12%, at the same time as formal employment is growing. Crucially, these contributions will increasingly funnel capital into local equities as the AFOREs cannot allocate more than 20% to foreign investments. The current allocation of pension funds to the Mexican equity market is just 6.7%. If local equity participation were to increase to 10%, the reforms could add $25bn of investment, equivalent to 7% of current Mexican market cap. This is an extremely important development that we have seen play out multiple times across EM. Chile was the first to introduce higher mandatory contributions. Valuations improved until it scrapped the cap on the proportion that could be invested overseas. There was a similarly positive situation in Poland until it nationalised its pension funds. Perhaps the most important recent example is India, which has introduced 401k-type schemes, albeit without mandatory contributions. Last year we saw all-time high valuations in India, despite foreign ownership in the market being at a 10-year low. For various reasons local investors are far more inclined to buy mid-cap stocks, which partly explains the relative re-rating of Indian mid-caps. Thus, Mexican pension reform should be particularly supportive of the domestic mid-cap space.
The top-down backdrop for Mexico would therefore appear to be very strong. But the top-down never buys a stock at TT, it merely allocates our research time, so the key question then becomes: can we find attractive stocks in the country? On previous occasions when we have been positive on Mexico from a top-down perspective, albeit to a lesser degree, it was difficult to find stocks at attractive valuations. But this is not the case today. To take just one example of a company that we currently own, Regional is perfectly aligned with the nearshoring opportunity discussed above, yet if we were to use its 10-year average multiple of 11x forward earnings and 2.2x book value, we derive 58% upside. Regional is a mid-cap financial institution that focuses primarily on small- and medium-sized companies in the northern part of the country. These are the exact companies that we expect to benefit most from the relocation of supply chains and the formalisation of the economy. The bank has delivered an impressive EPS CAGR of 22% since listing in 2011, with a consistent RoE of 19-20%.
This powerful combination of top-down and bottom-up analysis is the backbone of our process, and runs through all our portfolio holdings. At this point it is worth briefly running through our other key exposures as we believe they offer some of the greatest opportunities for alpha generation that we have seen for many years. Although the structural outlook for Brazil is arguably inferior to that of Mexico, we are seeing an even more extreme dislocation in terms of the cyclical macro backdrop and valuations. There are many attractive stocks trading three standard deviations ‘cheap’ relative to their history. However, the situation may be about to change. Investor concerns in Brazil around political risks and irresponsible fiscal policy are making way for more optimism around rate cuts happening sooner than expected as inflation eases and a fiscal pact is agreed. Finance Minister Fernando Haddad is gaining respect from market participants for his orthodox approach. Consequently, sentiment has shifted from being very negative to more balanced, with both international and local investors starting to bottom-fish, given low valuations. Meanwhile, strength in soft commodity exports would appear to underpin a cheap Brazilian currency, and high real interest rates have increased the carry appeal. We own a range of companies that will benefit from falling rates, including utility providers, financial exchanges and companies with relatively high levels of floating rate debt.
Indonesia is another overweight for us. We believe that the country will have a strong trade position in the coming years due to significant volume growth of nickel exports. This should lead to a structural improvement in Indonesia's current account, which is already in a good position. From a risk perspective, Indonesia has very healthy external balances, a low national debt-to-GDP ratio, particularly in terms of government debt, and high real rates. We believe that this type of economy will attract capital flows as the Fed rate cycle ends and the US dollar weakens. We own two Indonesian banks, which should be key beneficiaries of nickel-related FDI coming into the country.
Finally, we remain overweight Indian banks as we expect an investment upcycle to take hold in the country. We also believe that private-sector banks will continue to capture market share from their public-sector counterparts. However, our aggregate exposure in India is limited by reasonably full valuations in many areas of the market.
Our largest underweight is China. Although post-reopening economic data was reasonably encouraging in Q1, it has since weakened quite sharply, with property sales, retail figures and export data all down. At the same time, we are starting to see significant pressure on local government finances. Chinese local government entities have limited tax-raising power, and have instead been funding themselves through land sales to property developers for the past 20 years. However, with property developers struggling due to weak demand and excess leverage, local government revenues have dried up. This, combined with the fact that local governments also faced huge covid-related costs last year, means that they are now coming under real pressure. It is likely that property taxes will be rolled out to ease the pressure, but this is clearly negative for consumption, while federal bailouts will also probably become more commonplace over the next few quarters, which is bad for market sentiment. Youth unemployment is another growing problem as it is currently running at 20-30%, depending on whether one relies on official or unofficial figures. Taking all of the above into account, it would appear that China’s reopening dynamic has stalled in Q2, despite strong monetary stimulus and reserve rate cuts.
Drilling down into the various Chinese equity markets further, we are significantly underweight H-shares, which tend to represent the ‘old’ economy in the form of banks, cement and property companies. In our view these are structurally challenged businesses and we can see far better opportunities in other regions and markets. We are slightly overweight ADRs as, although they continue to be impacted by geopolitical tensions, the valuations are extremely compelling in our view. Finally, we are overweight A-shares. Since the beginning of the year we have been running rigorous screens to identify companies in the A-share space that are consistently growing their toplines at around 20%, with stable margins, and operating in sectors that are aligned with government policy. We therefore retain exposure to best-in-class structural compounders in thematics such as renewable energy, manufacturing and tech domestication, where Xi’s focus on national security and self-sufficiency is creating compelling opportunities.
Other notable underweights are Taiwan and Korea, where export sectors are vulnerable to a softening global demand outlook. However, this is somewhat offset by a structural acceleration in the adoption of AI chips within data centres. We are therefore concentrating our exposure in beneficiaries of this trend. After decades of research, AI has gone mainstream and the hype appears to be justified. Language is fundamentally a shared representation of the world, and by recognising patterns to identify relationships between words, AI can learn a usable model of the world. Whilst being able to pass the Turing Test and appear to demonstrate human-like intelligence is impressive, the real reason that Large Language Models are so profoundly transformative is that, by understanding the nature of language, they understand the world. This powerful technology could automate between 15-50% of work tasks in today’s economy. Clearly this will be hugely disruptive, with a total addressable market of somewhere between massive and revolutionary. We have a high conviction view that the value created from applying AI will be enormous. How that value is shared between corporate customers, workers and tech vendors is more uncertain. From an investment perspective, at this nascent stage we believe the safest plays are the “picks and shovels” of this theme. The new AI tech stack will be hugely data and compute intensive, and we therefore have exposure to leading companies operating in the memory, semiconductor and semiconductor manufacturing equipment spaces.
Given the compelling macro opportunities that exist across much of the EM space at present, we have doubled down on the basics of our time-tested process – developing strong top-down conviction and marrying that with thorough bottom-up stock picking. As a result, we believe our EM portfolios are very well set up for meaningful alpha generation throughout the rest of 2023 and beyond.
Nothing in this article constitutes or should be treated as investment advice or an offer to buy or sell any security or other investment. TT is authorised and regulated in the United Kingdom by the Financial Conduct Authority (FCA).