Back in 2008, when the global economy was mired in the largest financial crisis since the Great Depression, China unleashed a gigantic stimulus package worth 4 trillion yuan. Asia’s pre-eminent economic powerhouse led the world out of the downturn, with its rapid growth sparking a global recovery that helped bring the US and Europe back to life. Ten years after China “saved the world”, it is once again confronted by the threat of flagging growth, exacerbated by trade tensions with the US. With the country standing at an important crossroads, we analyse the risks as well as the opportunities in the world’s second-largest economy, and ask whether now is the right time to invest.

Shanghai skyscrapers. Source: Wikimedia
After 10 long years, the global recovery is undoubtedly maturing. China is not immune from this. Its economic growth rate has now slowed to 6.5%, the weakest pace since 1990. This slowdown is expected to continue, with growth forecast to be 6% next year.
Chinese GDP growth (%)
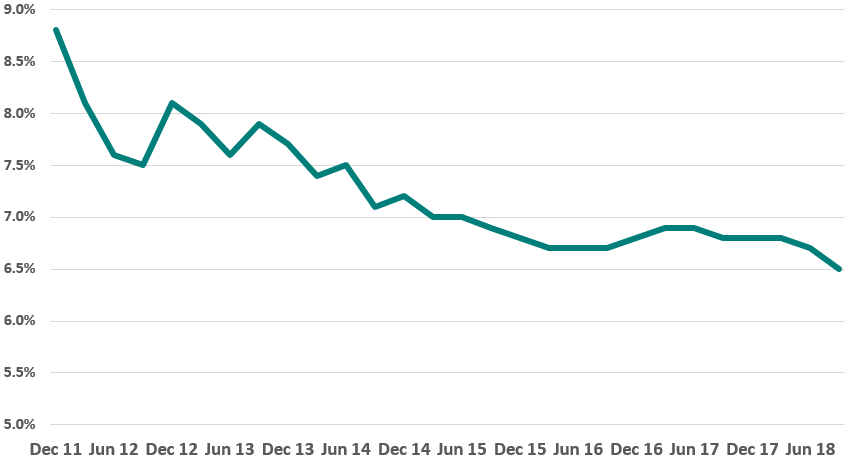
Source: TT International, Bloomberg
Thus, China’s economy was slowing even before President Trump decided to instigate a trade war, slapping a 10% tariff on $250bn of Chinese exports to the US. Such tariffs will only serve to exacerbate the existing Chinese slowdown. Indeed, economists estimate that they could reduce Chinese GDP growth by up to 0.5% per year. President Trump had been due to ratchet up tariffs even further to 25% at the start of 2019, but has now suspended this decision so that the two countries can attempt to strike a deal on a number of sensitive issues. While this is clearly a positive development, it is still very early days in the trade war ceasefire. US concerns about the protection of intellectual property and the long-term direction of Chinese industrial strategy remain deeply entrenched. Thus, while the breakthrough increases the chances of a deal being done, it is far from assured.
As Chinese growth has slowed, so the US economy has revved up, fuelled by generous tax giveaways. This is important as it means the economic growth differential between the US and China has narrowed.
China-US economic growth differential (%)
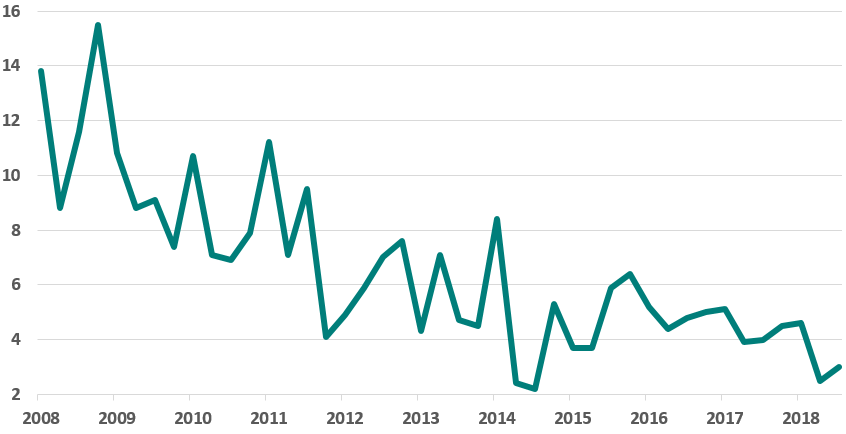
Source: TT International, Bloomberg
If you believe, as we do, that investors buy Emerging Markets, Asia, and China largely because of their superior growth prospects, then clearly a shrinking growth differential will be a headwind for these markets. In this context, the relative underperformance of Chinese equities and the renminbi this year is entirely logical.
So the
critical question for Chinese investors is, will this growth differential begin
to widen out and thereby attract foreign investors back to the market? We
believe the answer is yes. The acceleration in US growth has largely been due
to a significant fiscal boost, the impact of which will begin to wane. In fact,
the peak impact of the stimulus appears to already be behind us, with US growth
seemingly reaching its zenith in 2Q18. More recent data suggest that the US
economy is now slowing and this is likely to continue into next year, with 2Q19
having the toughest comps. While Chinese growth may also decelerate, the
slowdown should be modest by comparison, partly because Beijing is now looking
to offset the trade war impact with an accelerated reform programme as well as
monetary and fiscal easing.
This reform programme is likely to make China’s economy more dynamic by reducing government intervention, providing fewer subsidies for inefficient state-owned enterprises (SOEs), establishing a new national innovation system that improves intellectual property rights, and offering more assistance for private companies, which currently generate 80% of urban jobs and account for 70% of new patents.
In terms of monetary and fiscal easing, the People’s Bank of China has cut banks’ required reserve ratio three times this year and conducted cash injections through open-market operations, leading to lower interest rates. Meanwhile, China’s cabinet has instructed local authorities to accelerate infrastructure spending, a vital component of China’s economy. Elsewhere, the country’s legislature has approved cuts to personal income taxes designed to spur consumption. The cuts, which take effect in January, will be worth as much 0.5% of GDP next year and could boost retail sales by about 1%. Importantly, the authorities still have scope to do more. For example, the corporate tax burden in China is far higher than that of international peers, and could easily be cut to stimulate the economy further.
Corporate tax burden
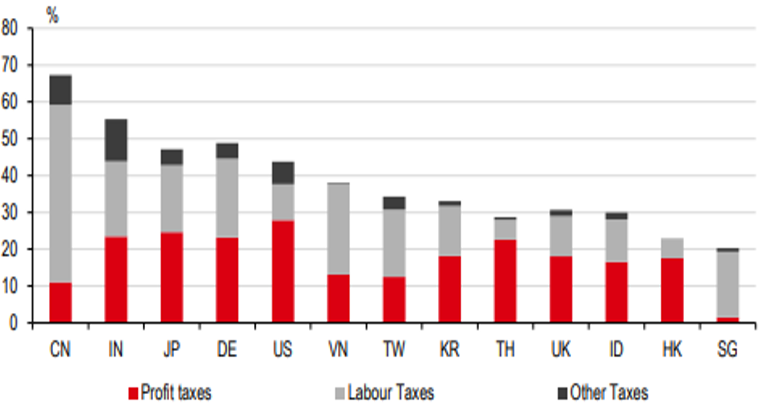
Source: HSBC
Just as China’s economy begins to be revitalised by a combination of the reform programme, stimulus measures and a weaker currency, the impact of fiscal easing will be fading in the US. Thus, the growth differential between the two countries should widen again, relieving the pressure on Chinese equities. We expect this to play out over the course of 2019. We are watching closely for inflection points in data such as the Chinese Producer Price Index, which can help confirm genuine changes in government policy and signal an acceleration in industrial activity. If we see improvements in such metrics, we would likely become more cyclical in terms of our positioning.
Up until now, we have been discussing relatively short-term growth trends. Of course, what is far more important to longer-term investors is the bigger picture. Here the story is far more clear cut. Put simply, Asian economies such as China and India will continue to drive the vast majority of global growth for years to come.
GDP Growth (%)
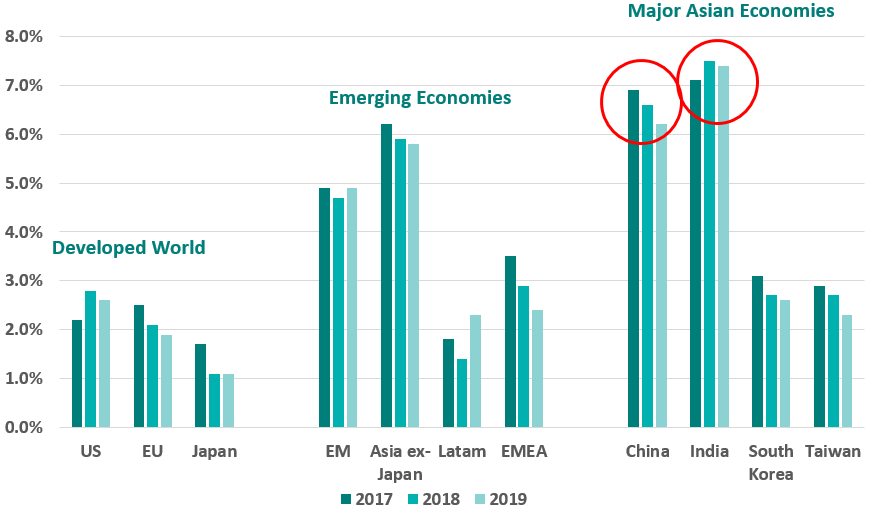
Source: TT International, Bloomberg
Even with the huge fiscal boost in the US this year, an acceleration of growth to 2.8% pales into insignificance compared to China and India. Meanwhile, the European Union continues to struggle and could well deteriorate further in the event of a disorderly Brexit and continued friction with Italy. The EU has elections in May, with current polling suggesting that a combination of the far right and far left candidates could take over 40% of the seats, threatening the future existence of the EU. Elsewhere, Japan continues to battle the effects of an aging population and insufficient immigration. Consequently, it will likely struggle to generate meaningful growth for many years.
Not only does Chinese growth far exceed that in the developed world, we also believe it is becoming higher quality, suggesting it will be more sustainable. In the past, China has relied on infrastructure investment fuelled by excessive debt to drive growth. This led to many risks including high corporate debt, excessive liquidity, shadow banking and capital market vulnerabilities, and real estate bubbles. Crucially however, Beijing is acutely aware of these risks and has looked to mitigate them using a combination of regulation, enforcement and liquidity controls. At the same time, it is shifting its economy towards a more sustainable consumption-based growth model. Indeed, consumption now accounts for almost 80% of Chinese economic growth.
Chinese consumption as a percentage of GDP growth
Source: TT International, Bloomberg
While higher quality growth may be slightly slower, it should be more evenly distributed and less volatile. Thus, China should continue to significantly outpace the developed world and looks set to overtake the US as the world’s largest economy in dollar terms by 2030.
Size of economy 2018 ($tn)
Source: HSBC
Size of economy 2030 ($tn)
Source: HSBC
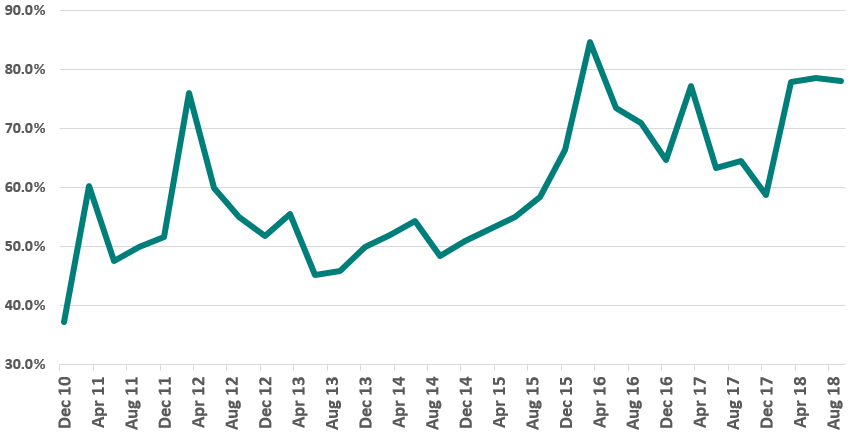
Given the consistently superior growth of Asian economies, particularly China, it is unsurprising that the region increasingly dominates EM equity indices. Over the last decade, the Asian weight in the MSCI EM index has risen from 55% to 73% today, with China’s weight now standing at 31%.
Weight of China and EM Asia in the MSCI Emerging Markets benchmark
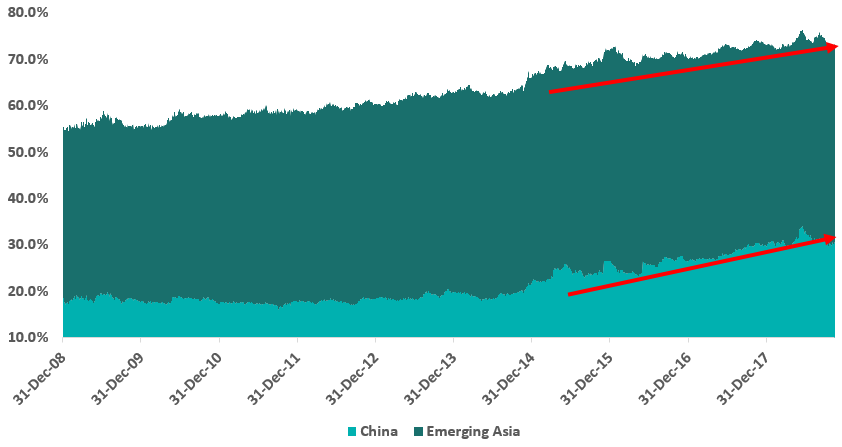
Source: TT International, Bloomberg
To us, this is reminiscent of 1980s Japan, which became so dominant in the Asian indices that investors decided to manage Japanese investments on a standalone basis. We expect the same to happen to China over the next decade. MSCI is already proposing to increase the inclusion factor of China large-cap A-shares in its EM index from 5% to 20% by August 2019. Such moves will ultimately crowd out other countries and companies unless Chinese investments are managed separately.
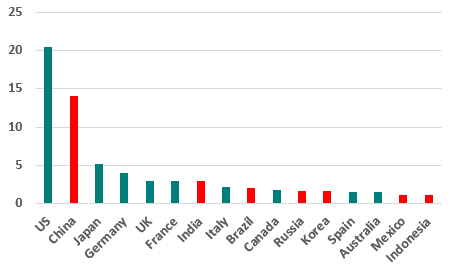
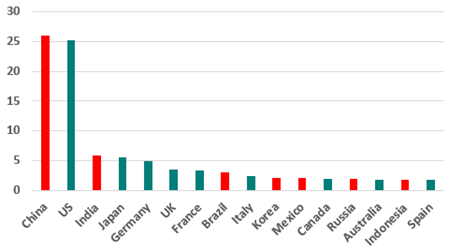
Despite China’s meteoric rise in the EM index, it is still very under-represented in world equity indices. Below we compare the GDP of various countries and regions to their corresponding stock market weight in the MSCI All Country World index.
China is clearly under-represented in world equity indices
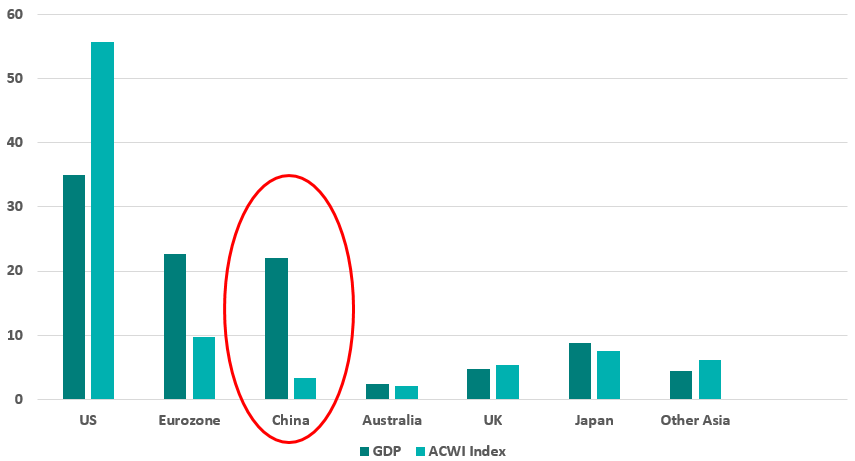
Source: World Bank. GDP is expressed as a percentage of the countries and regions shown.
Of course, there are many reasons for discrepancies between the two measures. For example, Germany has a high proportion of private companies compared to publicly listed ones. This may go some way to explaining why the Eurozone market weight falls significantly short of its GDP weight. However, even accounting for such discrepancies, China clearly stands out as having a world index weighting that is a tiny fraction of its economic strength. This suggests that its stock market has significant catch up potential over the medium- to long-term.
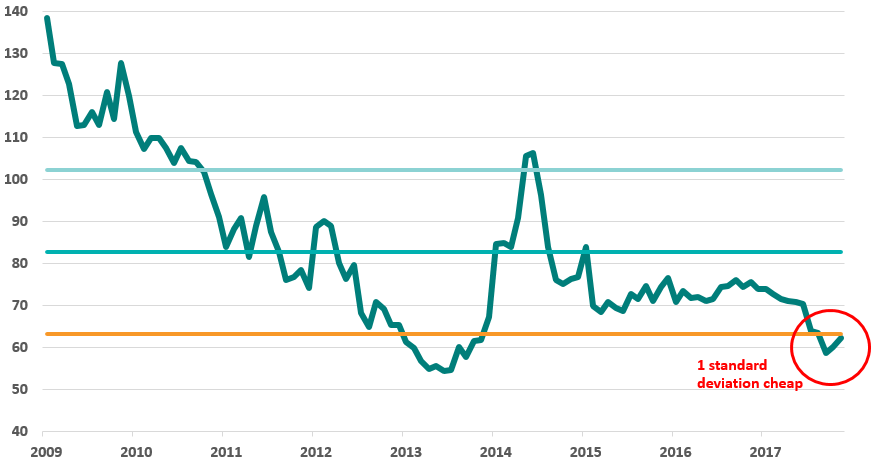
Despite these positive longer-term trends, China has relentlessly derated relative to the rest of the world, particularly the US. Indeed, on a price/earnings basis, it now trades at a 35% discount, close to its cheapest relative valuation in a decade.
China’s CSI 300 market P/E relative to the US S&P500
Source: TT International, Bloomberg
On an absolute basis, valuations are not quite as stark, but are still attractive.
China forward P/E ratio
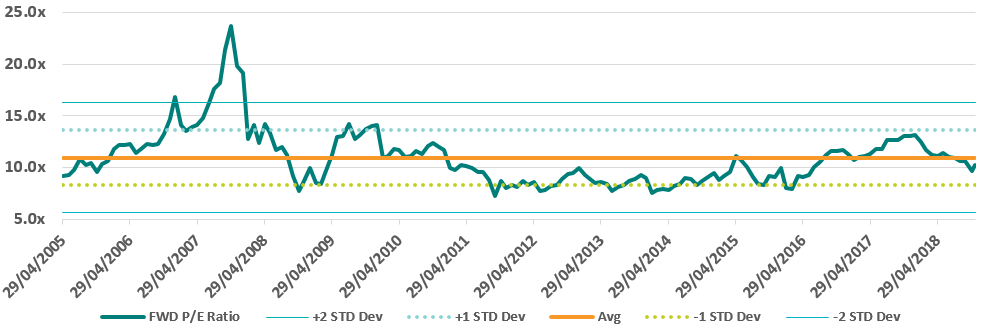
Source: TT International, Bloomberg
Viewed from another perspective, at these levels China offers the highest free cash flow yield of any major market in the world.
Forward free cash flow yield (%)
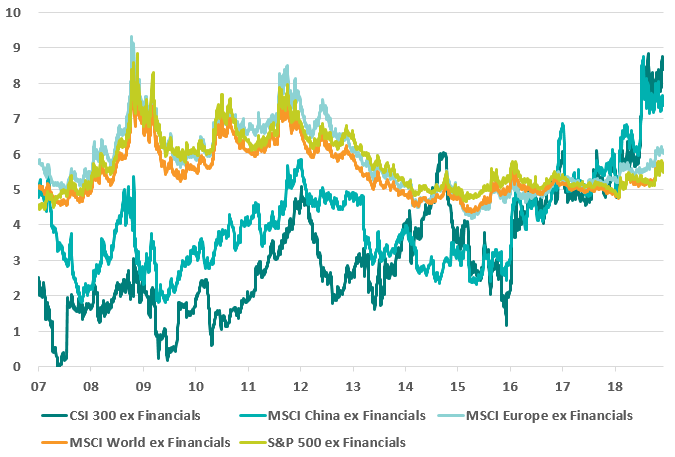
Source: TT International, Bloomberg
While historically markets have tended to bounce from these levels, China has been optically cheap for some time now, and could remain so for an extended period, or potentially become even cheaper. So is now the right time to buy?
As we see it, there are three major reasons for the Chinese derating and earnings cuts witnessed in 2018. Crucially however, we believe that all these thematics are now either improving, or well understood by the market and therefore discounted in current valuations. Firstly, after previously overstimulating, the government tried to delever the economy in 2015, which caused a sharp sell-off, and again in 2017. This can be seen in the Chinese Monetary Conditions index below.
Chinese monetary conditions
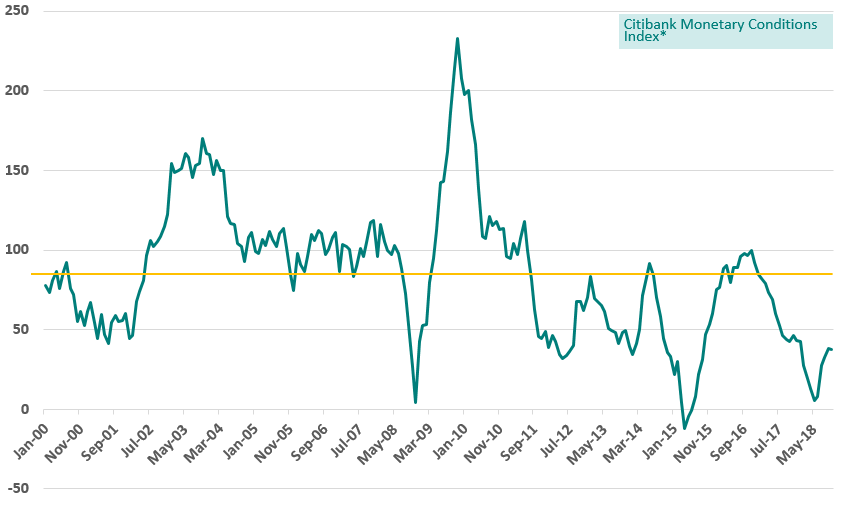
Source: Bloomberg. *Real interest rates, real effective exchange rates & loan growth.
The latest deleveraging campaign started to impact the Chinese economy and equity markets in 2018. However, Beijing is now loosening monetary conditions, which should stimulate the economy and support equities.
Secondly, as part of his move to consolidate power, President Xi implemented one of the biggest cabinet restructurings since the late 1980s in 2018. Of the 26 existing ministries, 22 were restructured, and 4 additional ministries were created. Additionally, the National Supervisory Commission was formed to oversee all ministries and ensure that they act in the best interests of the Communist Party. Such major restructuring led to an initial flurry of policy changes and additional regulatory burden, which weighed on company earnings and share prices. However, with the restructuring seemingly complete, we believe the worst of the regulatory changes are now behind us.
Thirdly, the trade war that President Trump instigated in 2018 is expected to reduce Chinese GDP and crimp corporate profitability. However, we believe that analyst estimates are assuming a worst case scenario. Indeed, in our view, they do not account for the price inelasticity of many goods, which should ensure that people continue to buy these goods even when the price rises. More importantly, analysts’ growth forecasts do not seem to have factored in the Chinese government’s countermeasures to stimulate the economy such as monetary easing and tax cuts. Thus, while concerns about trade wars are well-founded, we believe they are already discounted in current valuations and that there is scope for an upside surprise, particularly as Mr Trump has now agreed to halt any further tariffs while the two countries attempt to hammer out a deal.
Though our analysis suggests that multiples are unlikely to contract much further and indeed could expand, we should caveat this by saying that earnings could fall further over the coming months, complicating the timing of market entry. MSCI China earnings growth expectations are currently about 7% for FY19. However, with revenues likely to remain under pressure, this number may be slightly too high. Unfortunately, we are unlikely to see the market trough until earnings have bottomed out. We expect positive earnings surprises to begin in 2Q19 as cost-cutting efforts bear fruit and lower commodity prices feed through to bottom lines.
While timing the optimal point of market entry is always extremely challenging, for those with a longer investment horizon, we believe that the case for China is strong. Indeed, it would seem clear that China and other Asian economies will continue to drive global growth for the foreseeable future, that Chinese weights in global indices are only likely to rise, and that equity valuations in China have already substantially discounted investors’ concerns, mitigating downside risk.
For those considering investing in China, we firmly believe that active strategies offer the most compelling form of exposure. As can be seen below, China is home to a broad range of companies across several markets.
Chinese investment universe
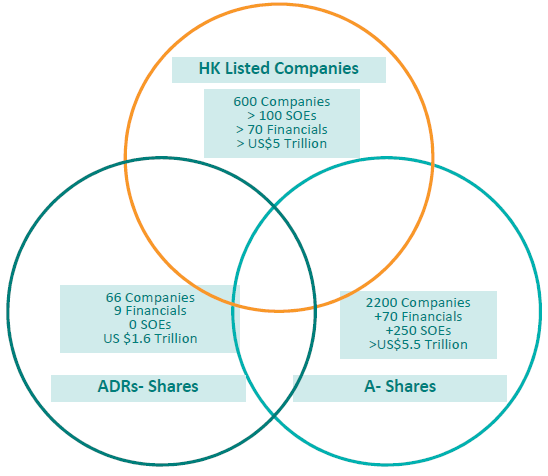
Source: TT International, Bloomberg. Investment universe defined as min market cap >$500m, benchmark weights as at 10/8/18
Given this vast universe, potential investors would be well within their rights to assume that buying an ETF product would provide well-diversified exposure to the market. Unfortunately however, passive investments would appear to be far less diversified than one might expect, with the bulk of index profits coming from one single sector, Financials.
MSCI China index – profits by sector
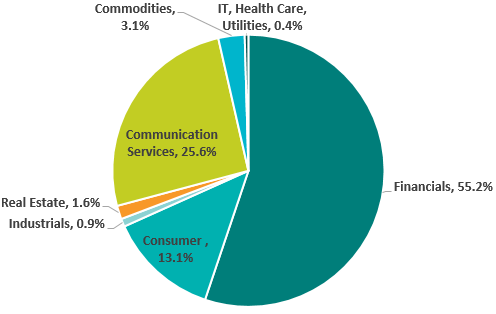
Source: TT International, Bloomberg
By contrast, active investment strategies have the ability to alter their exposure to various sectors based on where they believe the best opportunities lie. While we do not believe there are any systematic issues in the Chinese banking sector, we do believe the current non-performing loan cycle has further to run. Consequently, at the time of writing we are underweight Chinese Financials and own only one bank at present.
Active strategies also have the ability to specifically target another quirk of the Chinese market, namely its world-beating depth and liquidity in the small- to mid-cap segment.
Number of listed companies in each market cap segment
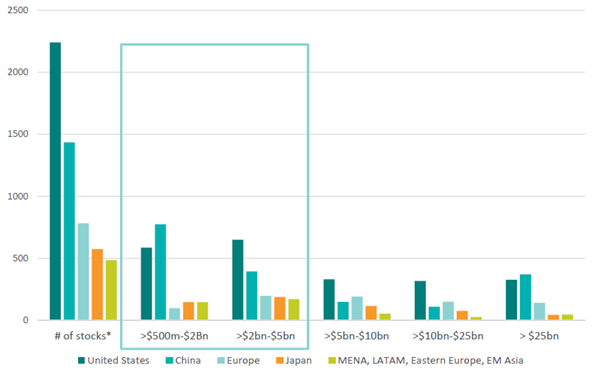
Source: TT International, Bloomberg. Criteria: >$5m daily turnover, >$500m market cap.
As can be seen above, Chine is home to more small- to mid-cap companies than any other market. Our active equity strategies, including China, Global Emerging Markets and Asia ex-Japan, have demonstrated a time-honoured ability to be particularly effective in this area of the market. Indeed, this is often where we are able to add most alpha for clients as these stocks are typically under-researched, with a longer growth runway ahead of them.
Finally, active strategies such as ours have the ability to offer exposure to the most promising structural trends in a way that passive investments cannot. At the time of writing, we have significant exposure to several compelling structural themes. Firstly, a combination of SOE reform and the Blue Skies environmental policy has led to a reduction in supply-side capacity. This has boosted pricing power for ‘Old Economy’ companies in the cement, coal and steel industries, allowing them to generate higher free cash flow, and ultimately recapitalise their balance sheets. We have been overweight this theme for some time. However, this trend is increasingly understood by the market. If it were a baseball game with nine innings, we would likely be some way through the seventh in terms of the theme being price in. Consequently, we have recently been taking profits in some of our holdings here.
Another theme that we have significant exposure to is what we call the “Second Wave” of consumption. We believe that consumer demand in Emerging Markets is shifting as people’s needs and aspirations evolve. The old emerging consumption stories of staples and durables, while by no means fully played out, are being replaced by a new focus on consumption of services – especially health, education and sophisticated financial services. This helps to explain the fund’s significant exposure to Chinese insurers. Over time we expect demand for protection type insurance products to accelerate. We find that as people get wealthier, they demand more protection. Indeed, both sum assured per capita and life premium/GDP correlate well with GDP per capita. This is important because selling protection products is more profitable for insurers than selling savings linked products. Thus, the insurers that we own are enjoying strong growth in the value of new business they generate. We expect this growth to continue, particularly as insurance penetration in China is just 2.3% of GDP. This means that China spends $190 per capita whereas Developed Asia spends >$2000 per capita.
We also have exposure to Chinese innovation and technology. Companies in this space benefit from China being a vast single market with a fast-adopting, highly interactive user base. This enables companies to expand rapidly and therefore benefit from scale advantage. Given the significant multiple compression that Chinese technology companies have seen recently, we have used weakness to add to our positions.
While the short-term direction of Chinese equity markets is unclear, we believe that the long-term investment case for China is compelling, as is the case for an active strategy that can focus exposure on the most lucrative areas of the market. These could be smaller, under-researched companies with longer growth runways, or secular themes such as the underpenetration of insurance products in China.
We believe the TT China Focus Strategy is particularly well placed to generate attractive risk-adjusted returns for investors. It uses a combination of top-down and bottom-up research as a means of allocating capital. Our top-down process informs our bottom-up research by allowing us to focus on specific sectors and industries that we expect to derive the greatest benefit from the economic and political trends that we have identified.
In addition to the strong top-down/bottom-up linkage, the following aspects of our investment process provide an edge and set the TT proposition apart from the competition:
- This is a high
conviction, focused portfolio, with an unconstrained
investment universe that enables us to buy the most attractive Chinese
companies wherever they are listed.
- The strategy aims to offer superior returns by
investing in higher quality, higher growth companies on attractive valuations with positive
earnings and share price momentum. It has a strong valuation discipline, with a particular focus on free cash flow. Thus, the portfolio
typically exhibits faster earnings growth than the index, as well as a higher
ROE than the index, whilst at the same time being less leveraged than the
index. We achieve these superior growth and quality metrics whilst maintaining
valuation discipline and consequently the portfolio is cheaper than the index.
- The strategy targets long-term structural growth themes within China such as innovation
and premiumisation.
- Our highly
experienced investment team speak both Mandarin and Cantonese. Based in
Hong Kong, they have monthly research
visits to the mainland to meet companies and utilise TT’s panel of expert networks for additional on the
ground expertise.
- Unlike many traditional long-only managers, TT’s
hedge fund heritage ensures that our risk
management capabilities are outstanding and thus are able to play an
important role in the investment process. The fact that I, Marco Li, as Lead
Portfolio Manager, have a significant portion of my liquid wealth invested in
the strategy helps to ensure that absolute as well as relative risk is
considered.
To find out more about this strategy, please contact your TT sales representative on the details below.
Nothing in this document constitutes or should be treated as investment advice or an offer to buy or sell any security or other investment. TT is authorised and regulated in the United Kingdom by the Financial Conduct Authority (FCA).